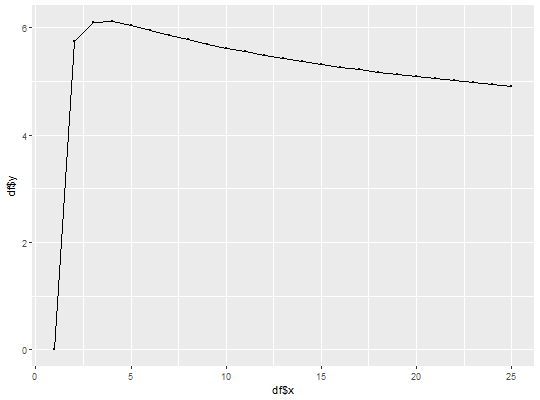
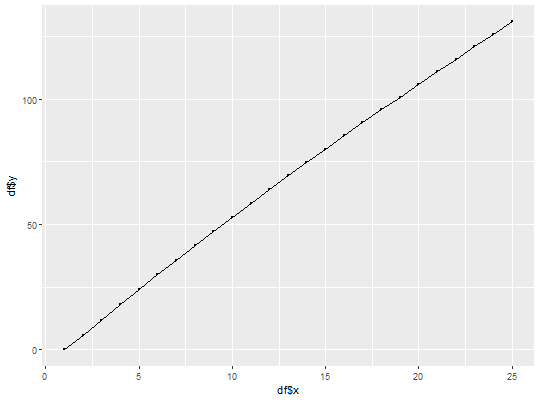
Crawford vs. Wright Delta Plot
Plots the delta of hours (or cost) per unit between Crawford's unit model and Wright's cumulative average model.
plot_delta(t, m, n, r, level = "u")
Arguments
- t
- time (or cost) required to produce the mth unit
- m
- mth unit for which you have time (or cost) information (default is m = 1)
- n
- the nth unit you wish to predict the time (or cost) for when comparing unit predictions or the last unit in the block when comparing cumulative time (or costs)
- r
- learning curve rate
- level
- plot the delta between the Crawford and Wright models at the unit ("u") or cumulative ("c") level
Examples
# The first unit of production is expected to require 50 hours and # the learning rate is expected to be 88.5%. However, the estimator # is not sure whether the learning rate is based on the unit model # or cumulative average model and wants to understand the difference # between potential outcomes for each unit. # Plot the differences between per unit time requirements plot_delta(t = 50, m = 1, n = 25, r = .885)# Plot the differences between cumulative time requirements plot_delta(t = 50, m = 1, n = 25, r = .885, level = "c")