Learning Curve Plot
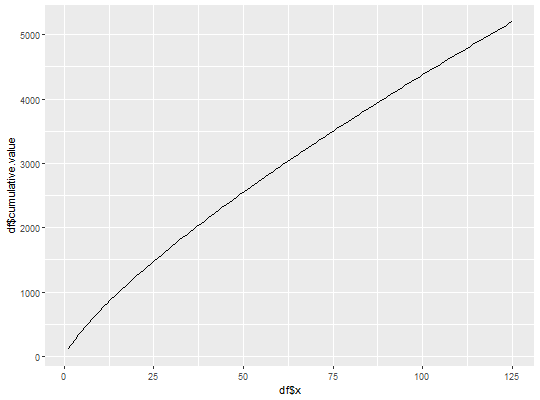
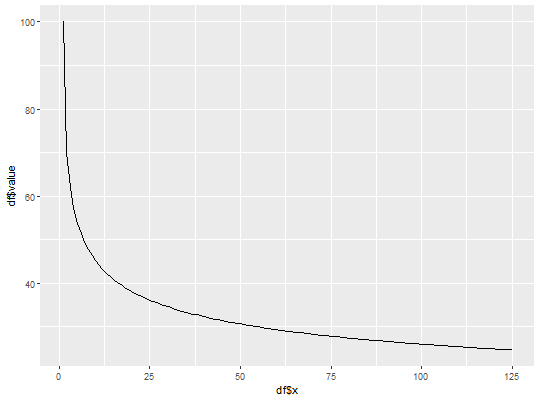
Plots the learning curve for units m through n. Allows you to choose between the Crawford and Wright models and also between a unit level plot or a cumulative level plot.
plot_unit_curve(t, m, n, r, model = "u", level = "u")
Arguments
- t
- time (or cost) required for the mth unit of production
- m
- mth unit for which you have time (or cost) information (default is m = 1)
- n
- nth unit of production you wish to plot the learning curve through (n > m)
- r
- learning curve rate
- model
- choose between the Crawford ("u") or Wright ("ca") models or plot both models with "both"
- level
- plot the learning curve at the unit ("u") or cumulative ("c") level
Examples
# library(learningCurve) # An estimator wants to plot the learning curve for for units # one through 125 where the first unit requires 100 hours and # the learning rate is 85%. # plot the time (or cost) per unit based on Crawford's Unit # Learning Curve Function plot_unit_curve(t = 100, m = 1, n = 125, r = .85)# plot the cumulative time (or cost) per unit based on Crawford's # Unit Learning Curve Function plot_unit_curve(t = 100, m = 1, n = 125, r = .85, level = "c")# plot the time (or cost) per unit based on Wright's Cumulative # Average Learning Curve Function plot_unit_curve(t = 100, m = 1, n = 125, r = .85, model = "ca")# plot the cumulative time (or cost) per unit based on Wrights's # Cumulative Average Learning Curve Function plot_unit_curve(t = 100, m = 1, n = 125, r = .85, model = "ca", level = "c")