
“Water, water, everywhere, nor any a drop to drink” - Samuel Taylor Coleridge
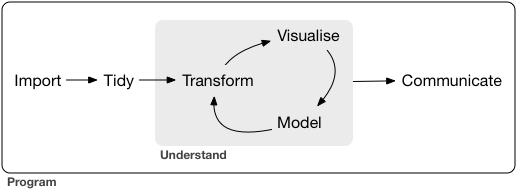
Synonymous to Samuel Taylor Coleridge’s quote in Rime of the Ancient Mariner, the degree to which data are useful is largely determined by an analysts ability to turn raw data into understanding, insight, and knowledge. The process to make this happen is considered the analytic cycle and the purpose of this class is to teach you the tools available in R to perform this process effectively and efficiently.
Consequently, this course takes a meandering route through the analytic process to help build a solid foundation.
First, data are arriving from multiple sources at an alarming rate and analysts and organizations are seeking ways to leverage these new sources of information. Consequently, analysts need to understand how to import data from these sources. Furthermore, since analysis is often a collaborative effort analysts also need to know how to share their data. This course will cover the basics of importing tabular and spreadsheet data, scraping data stored online, and exporting data for sharing purposes.
Second, data wrangling is all about getting your data into the right form in order to feed it into the visualization and modeling stages. This typically requires a large amount of tidying and transforming of your data. This process requires the ability to work with different forms of data - structured and unstructured. By Tidying your data, you create consistent structure that lets you focus your struggle on questions about the data, not fighting to get the data into the right form for different functions. Once you’ve created tidy data the next step is often data transformation to filter, summarize, arrange, and join your data. This course will explain how to execute these common data wrangling activities.
Third, visualization is a fundamental analytic activity. A good visualization will show you things that you did not expect, or raise new questions about the data. A good visualization might also hint that you’re asking the wrong question, or you need to collect different data. And good visualizations are key to communicating your results to decision-makers! This course will illustrate how to create high-quality data visualizations.
Fourth, analytic modeling provides a vast set of tools for understanding data. These tools can include unsupervised approaches such as principal components analysis and cluster analysis to find common groupings within your data. It can also include supervised approaches such as time series forecasting, linear and non-linear regression, classification and regression trees, support vector machines, neural networks, etc. to predict future outputs. As an analyst, it’s important to learn how to identify and implement the modeling technique that best aligns with the question being asked. This course will expose you to a breadth of analytic techniques; however, each student will be responsible for learning their own technique thoroughly enough to apply and teach it!
Fifth, learning different ways to communicate your results is absolutely critical for any data analysis project. It doesn’t matter how well your models and visualization have led you to understand the data unless you can effectively communicate this to the decision maker.
Finally, surrounding all these tools is programming, which requires being comfortable writing code. Programming is a cross-cutting tool that you use in every part of an analytic project. You don’t need to be an expert programmer to be a good analyst, but learning more about programming pays off because becoming a better programmer allows you to automate common tasks, solve new problems with greater ease, and ensure that your work is reproducible. This course will teach you the necessary programming skills to be an effective and efficient analyst.