04 Aug 2017
 Smoothing methods are a family of forecasting approaches that average values over multiple periods in order to reduce the noise and uncover patterns in the data. Moving averages are one such smoothing method. In this new time series tutorial, you will learn the basics of performing smoothing averages.
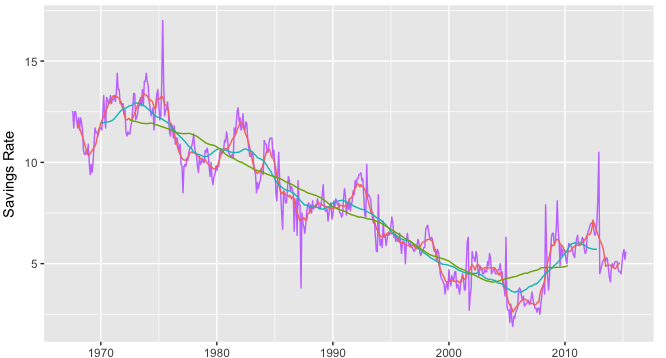
16 Jun 2017
 In this new time series tutorial, you will learn general tools that are useful for many different forecasting situations. It will describe some methods for benchmark forecasting, methods for checking whether a forecasting model has adequately utilized the available information, and methods for measuring forecast accuracy. These are important tools to have in your forecasting toolbox as each are leveraged repeatedly as you develop and explore a range of forecasting methods.
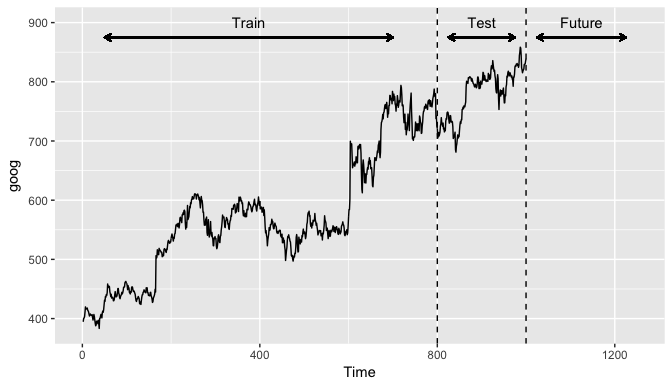
02 Jun 2017
 Time series forecasting is performed in nearly every organization that works with quantifiable data. Retail stores forecast sales. Energy companies forecast reserves, production, demand, and prices. Educational institutions forecast enrollment. Goverments forecast tax receipts and spending. International financial organizations forecast inflation and economic activity. The list is long but the point is short - forecasting is a fundamental analytic process in every organization. This new tutorial gets you started doing some fundamental time series exploration and visualization.
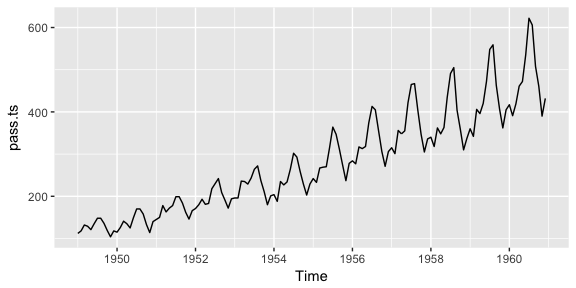
21 Apr 2017
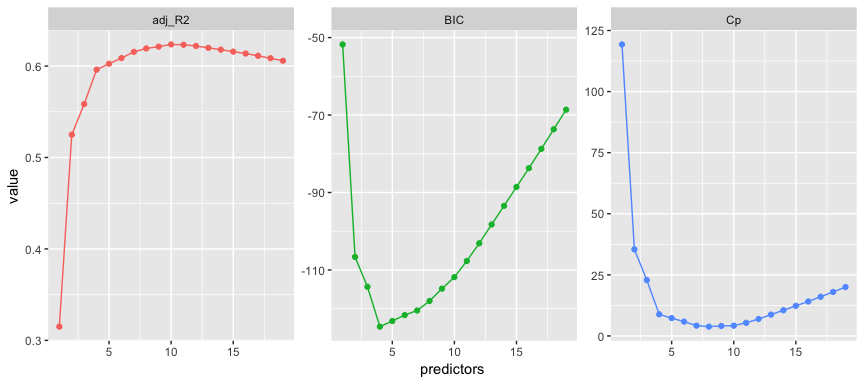
It is often the case that some or many of the variables used in a multiple regression model are in fact not associated with the response variable. Including such irrelevant variables leads to unnecessary complexity in the resulting model. Unfortunately, manually filtering through and comparing regression models can be tedious. Luckily, several approaches exist for automatically performing feature selection or variable selection — that is, for identifying those variables that result in superior regression results. This latest tutorial covers a traditional approach known as linear model selection.
07 Apr 2017

Although R provides built-in plotting functions, ggplot2 has become the preeminent visualization package in R. ggplot2 implements the Grammar of Graphics theory making it particularly effective for constructing visual representations of data and learning this library will allow you to make nearly any kind of (static) data visualization, customized to your exact specifications. This intro tutorial will get you started in making effective visualizations with R.
